We have recently released Stack Insights for our users. Using Stack Insights, we enable LocalStack users to report AWS API usage telemetry of LocalStack runs to your LocalStack account. It allows our users to see which APIs are being used, which clients of integrations use particular services and API operations, which services cause the most API errors, and much more.
Getting started
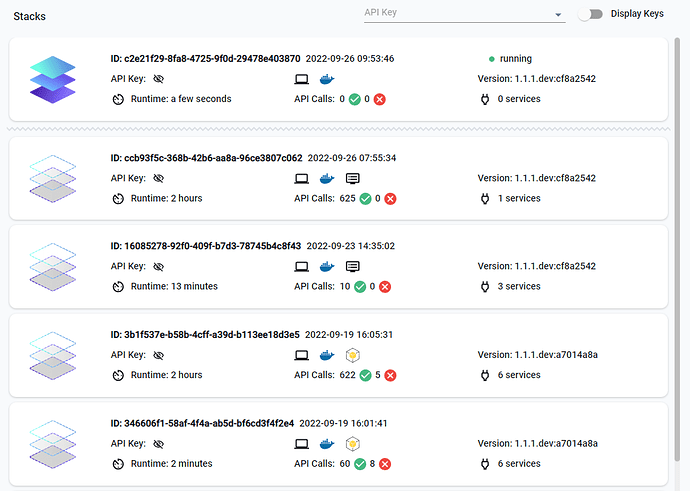
To get started with this feature, log in to your LocalStack account and start a LocalStack instance on your local machine. The LocalStack Dashboard will show the Stacks widget, which holds most of the vital information of recent and currently running stacks.
The Stack widget will also display the number of API calls, services employed and the runtime duration for each spin-up. All the spin-ups are timestamped; hence you can easily navigate the stacks and check the number of API calls that succeeded and failed.
Detailed Stack information
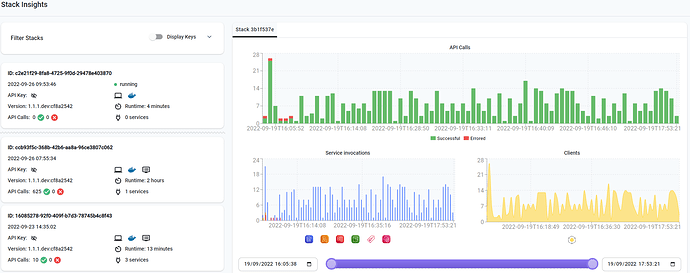
You can click on the individual stack to display detailed information. This includes the number of API calls, service invocations, the user agent (aws-cli, terraform etc.) and the particular service called in the specific spin-up.
You can also use the slide toggle to pick up a particular time duration during which the user made specific API calls.
List of events during the Stack life-time
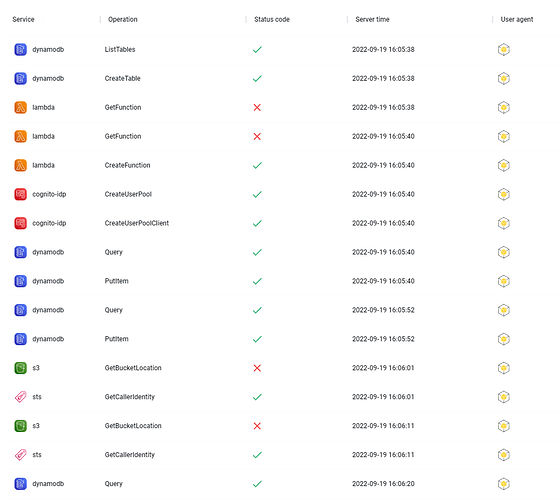
You can also check the list of events during the entire Stack life-time, which includes the Service, operation, Status Code, Server time and the User-agent.
Conclusion
The Stacks widget and detailed Stack information is part of our Pro plan, while the graphical representation currently falls under our Team preview. LocalStack team ensures that no sensitive data of your stacks are collected, and we are continuously working to improve the user interface and would appreciate any feedback!


